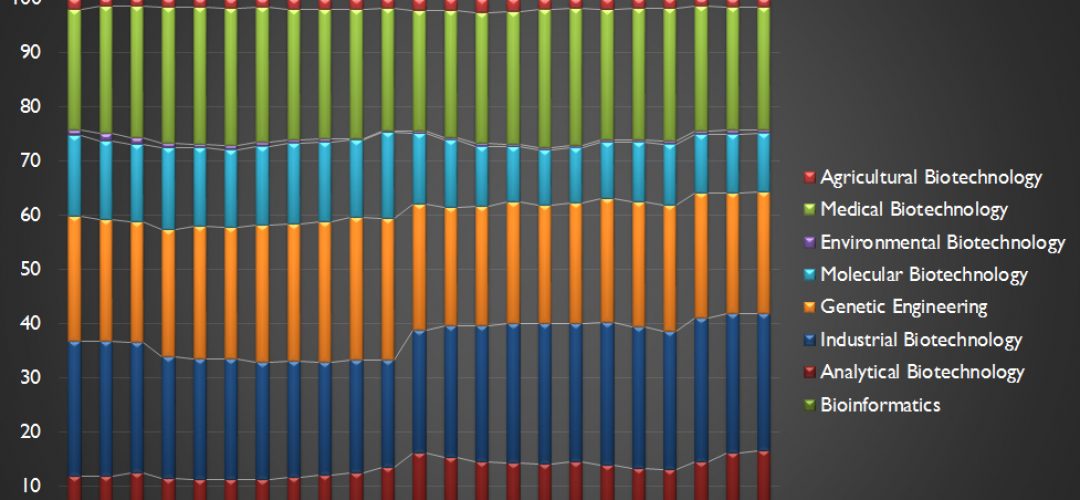
The “Report on statistics and indicators of biotechnology and nanotechnology” provides a summary of trends and developments in biotechnology and nanotechnology over the last 20 to 25 years, based on the longitudinal analyses of patents. In addition, an experimental indicator, which aims to identify trends and developments of research areas of biotechnology and nanotechnology, was introduced: publication titles of the two technology fields were analysed using a text-mining approach, and an overlay map of the most often use keyword co-occurrences was created, in order to visualise the developments over time in each research area. (Detailed additional material of this analysis can be found in the article entitled “Visualisation of Technology Convergence”.)
On behalf of and in collaboration with the OECD and its expert working groups, the author, Dr Steffi Friedrichs, re-confirmed indicators and measurement methodology for the multidisciplinary and partially overlapping technologies with a view to establishing uniquely accurate and relevant datasets.
20 Years of Patenting Biotechnology and Nanotechnology
The number of biotechnology and nanotechnology patents filed between 1990 and 1999 follows the trend in the increase of all patent numbers filed worldwide.
![Development in biotechnology patent applications, 1990-2012 (number of IP5 patent families by inventor’s country and priority date; see also: NOTE and SOURCE below) [Source (adapted): Steffi Friedrichs, OECD STI Working Papers, 2018/06]](https://acumenist.com/wp-content/uploads/2018/03/20180327_Fig2-1-Development-in-biotechnology-patent-applications-1990-to-2012.jpg)
[Source (adapted): Steffi Friedrichs, OECD STI Working Papers, 2018/06]
In contrast to the field of biotechnology, however, where the top patenting economies all follow a similar trend in patenting behaviour, the trend in the number of nanotechnology patents filed by the one major patenting economy differs significantly from that of another: in this context, it is noteworthy that Japan, which in 1990 filed over 50% of all nanotechnology patents, since 1998 lost a significant part of its global nanotechnology patent share to a surge in patenting by Korea, the People’s Republic of China (hereafter “China”) and Chinese Taipei.
![Development in nanotechnology patent applications, 1990-2012 (number of IP5 patent families by inventor’s country and priority date; see also: NOTE and SOURCE below) [Source (adapted): Steffi Friedrichs, OECD STI Working Papers, 2018/06]](https://acumenist.com/wp-content/uploads/2018/03/20180327_Fig2-1-Development-in-nanotechnology-patent-applications-1990-to-2012.jpg)
Revealed Technological Advantages in Biotechnology and Nanotechnology
The Revealed Technological Advantage (RTA) index is commonly used to compare patenting behaviours between economies, without necessarily going into the reasons behind the observed differences. The RTA is defined as the share of an economy’s patents in a particular technology field relative to the share of total patents in that economy. The index is equal to zero when the economy has no patents in a given field; is equal to 1, when the economy’s share in the sector equals its share in all fields (no specialisation); and above 1 when a positive specialisation is observed.

nanotechnology, 1990-2013 (normalised index for selected economies; see also: NOTE and SOURCE below)
[Source (adapted): Steffi Friedrichs, OECD STI Working Papers, 2018/06]
In the case of biotechnology, quite a few economies show a constant strong RTA over all of the three-year periods analysed since 1990: Denmark’s steadily high RTA in biotechnology (i.e. with a value between 1.7 and 2.6) certifies the economy’s strong specialisation in biotechnology. Similar observations can be made for Australia and New Zealand: these countries’ specialisation is very different from the one observed for China, where a single high RTA in 1998 – 2001 is caused by the patent surge previously discussed.
In the case of nanotechnology, however, most countries show a low or even negative normalised RTA. These findings indicate that nanotechnology is a very fast moving and changing field, in which many economies file patents in short surges of innovation, and few economies specialise for long enough, in order to develop a patent portfolio in nanotechnology that would yield a steadily positive normalised RTA over a three-year period, as is calculated here.
Follow this link to access the full “Report on statistics and indicators of biotechnology and nanotechnology” on the OECDiLibrary.
Patent data:
NOTE: Patent counts are based on IP5 patent families, according to the earliest filing date, using fractional counts. Patents are allocated to technology domains on the basis of their International Patent Classification (IPC) codes.
SOURCE: OECD, STI Micro-data Lab: Intellectual Property Database, http://oe.cd/ipstats, October 2016.


